2.2.4 | 1/29/2024
Support Page | Enable Debug Mode | Open Browser Developer Console Logs | Shortkeys Developer Console
Troubleshooting made easy!
In rare instances, you might encounter issues with your template when using Mambo Merge. To efficiently diagnose and address these issues, accessing additional information from the Mambo Merge component through Debug Mode can be immensely helpful. Let’s go ahead, enable it and get into how to Troubleshoot.
Step 1 - Start on a page where the Mambo Merge Component is already added. ↵
It helps to go to the component you are planning to troubleshoot.
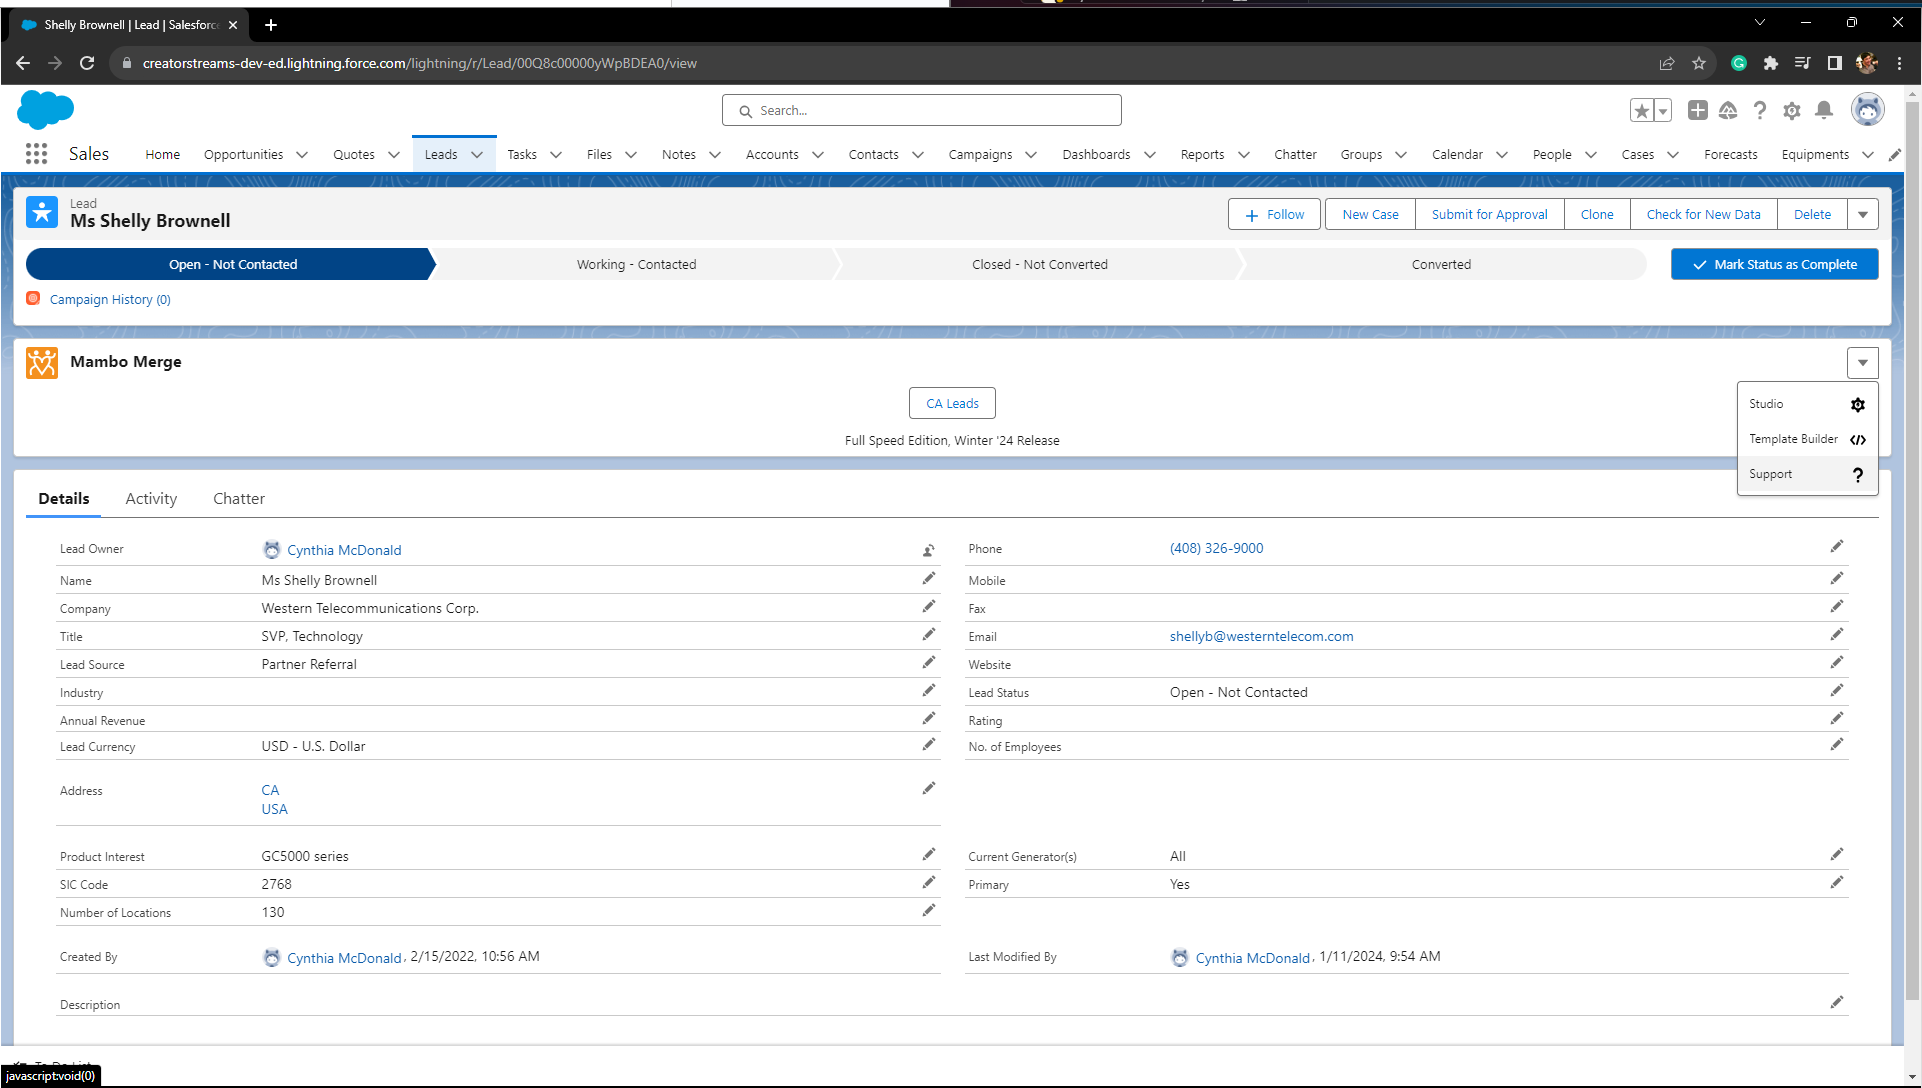
Step 2 - Right-click the arrow dropdown on the Mambo Merge Component and select “Support.” ↵
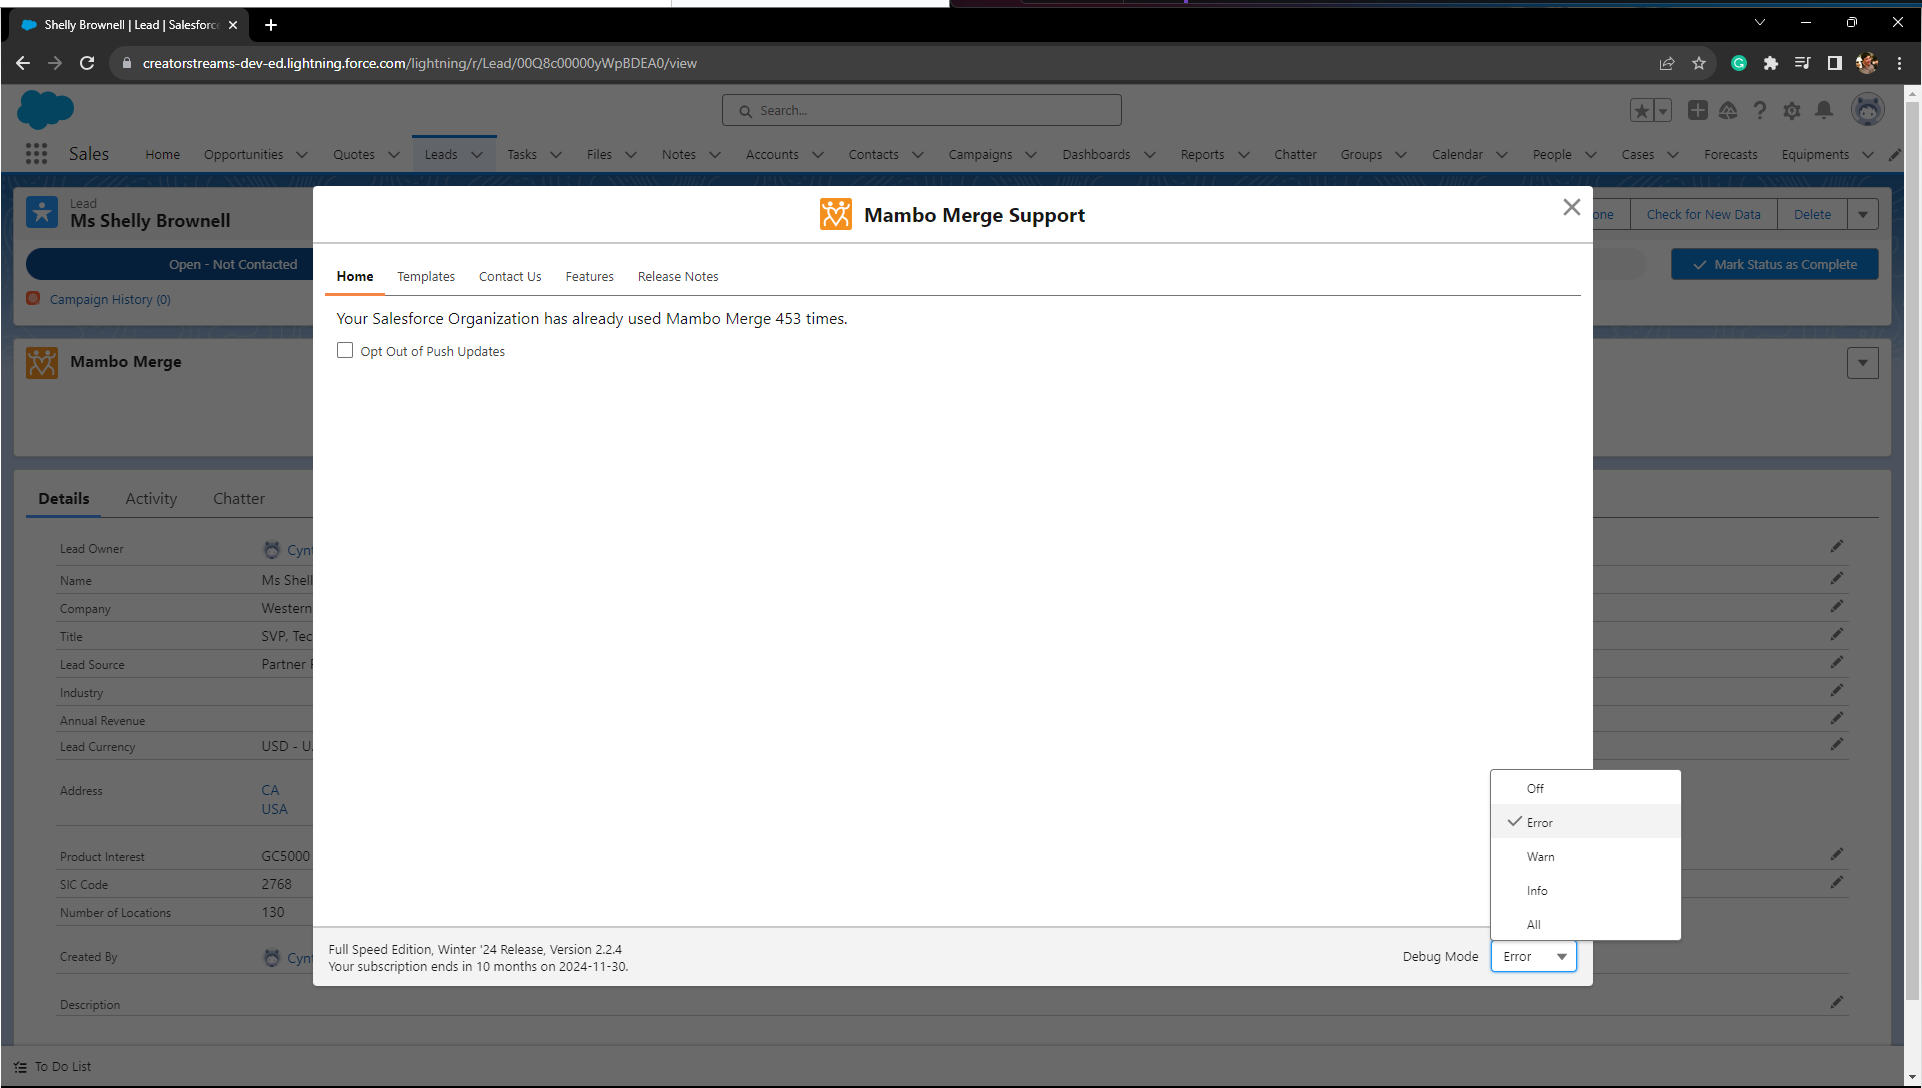
Step 3 - In the footer of the Support Window, locate Debug Mode at the bottom right. Click on the dropdown and choose the desired mode. ↵
Different Debug Mode levels provide varying behind-the-scenes information, with higher levels including details from lower levels. Here are the different levels and their descriptions:
-
All: Detailed information like merge field values, conditional evaluations, and the start of each function.
-
Info: Important messaging like generating/saving documents and editing configurations.
-
Error: Errors are displayed in the console, such as Bad Routine Id or issues with conditional tags.
-
Warn: Provides warnings, such as empty fields for merge fields found in the template.
-
Off: No information is displayed in the console.
Note: Changing the Debug Mode Level on one component affects all components globally.
Note: If Debug Mode is activated through the checkbox in the Edit Page, the level for the component will be at least ‘info’(How to enable Debug Mode Through Edit Page).
Time to pull out the Browser Console. There are different options for opening the console to read your console logs.
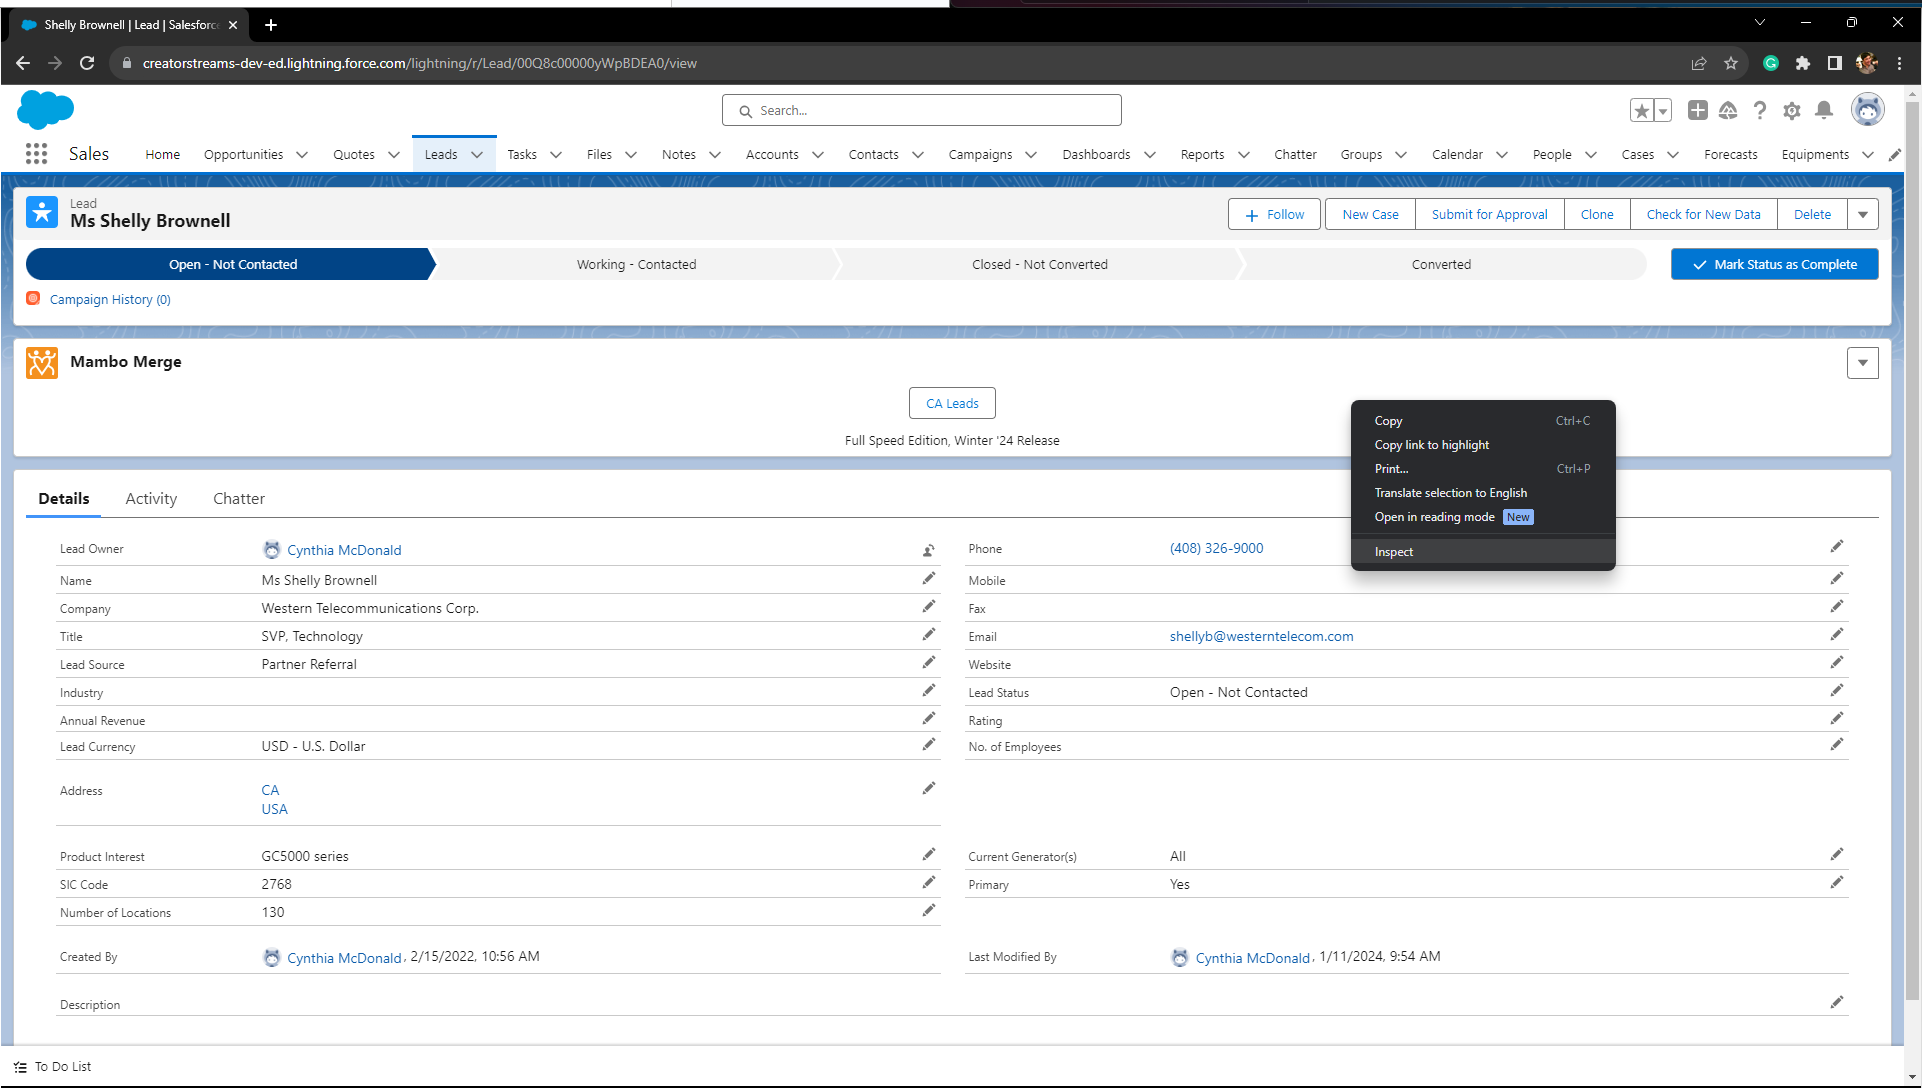
Step 4 - Open Browser Console Logs through right-click. ↵
Step 4.1 - Right-click on the page, select “Inspect” from the dropdown menu.
Note: The Browser used in the example is Chrome.
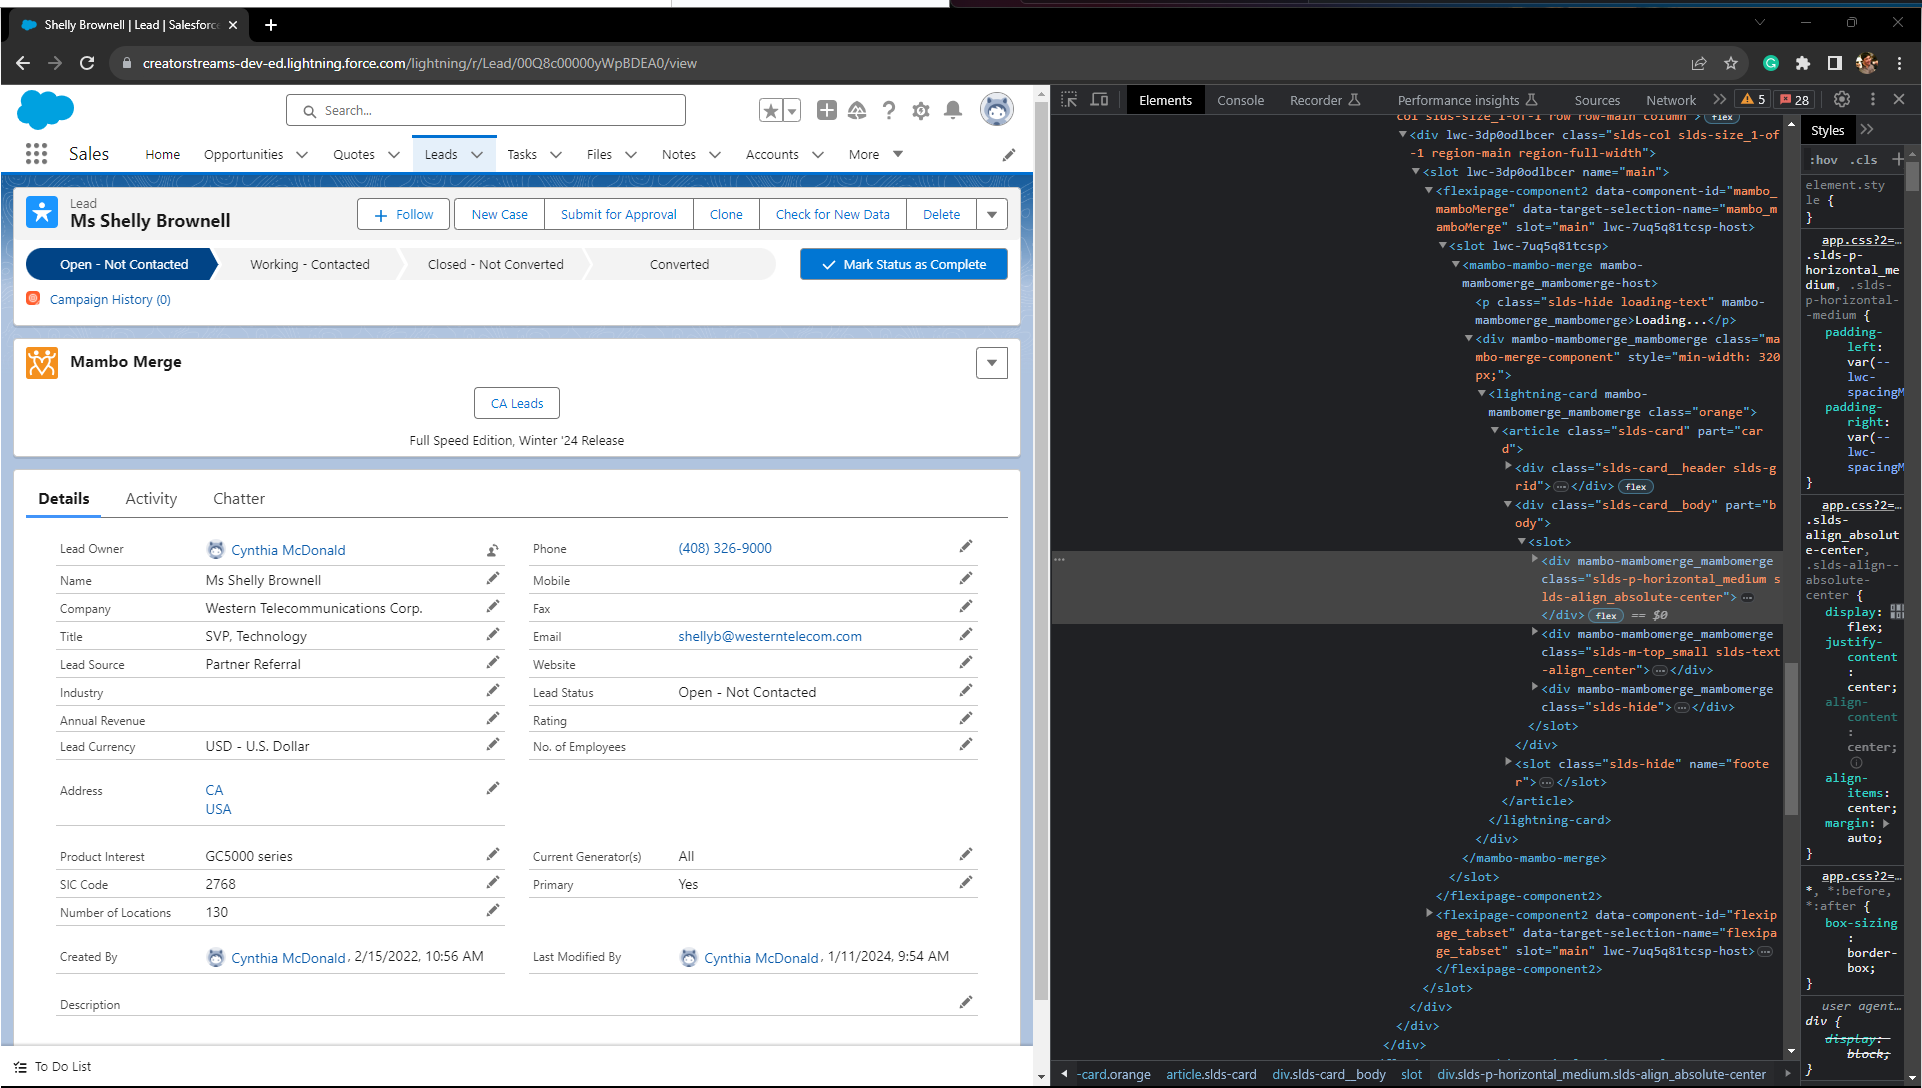
Step 4.2 - A panel appears on the right side of the Browser. In the top row, select the second option, “Console”.
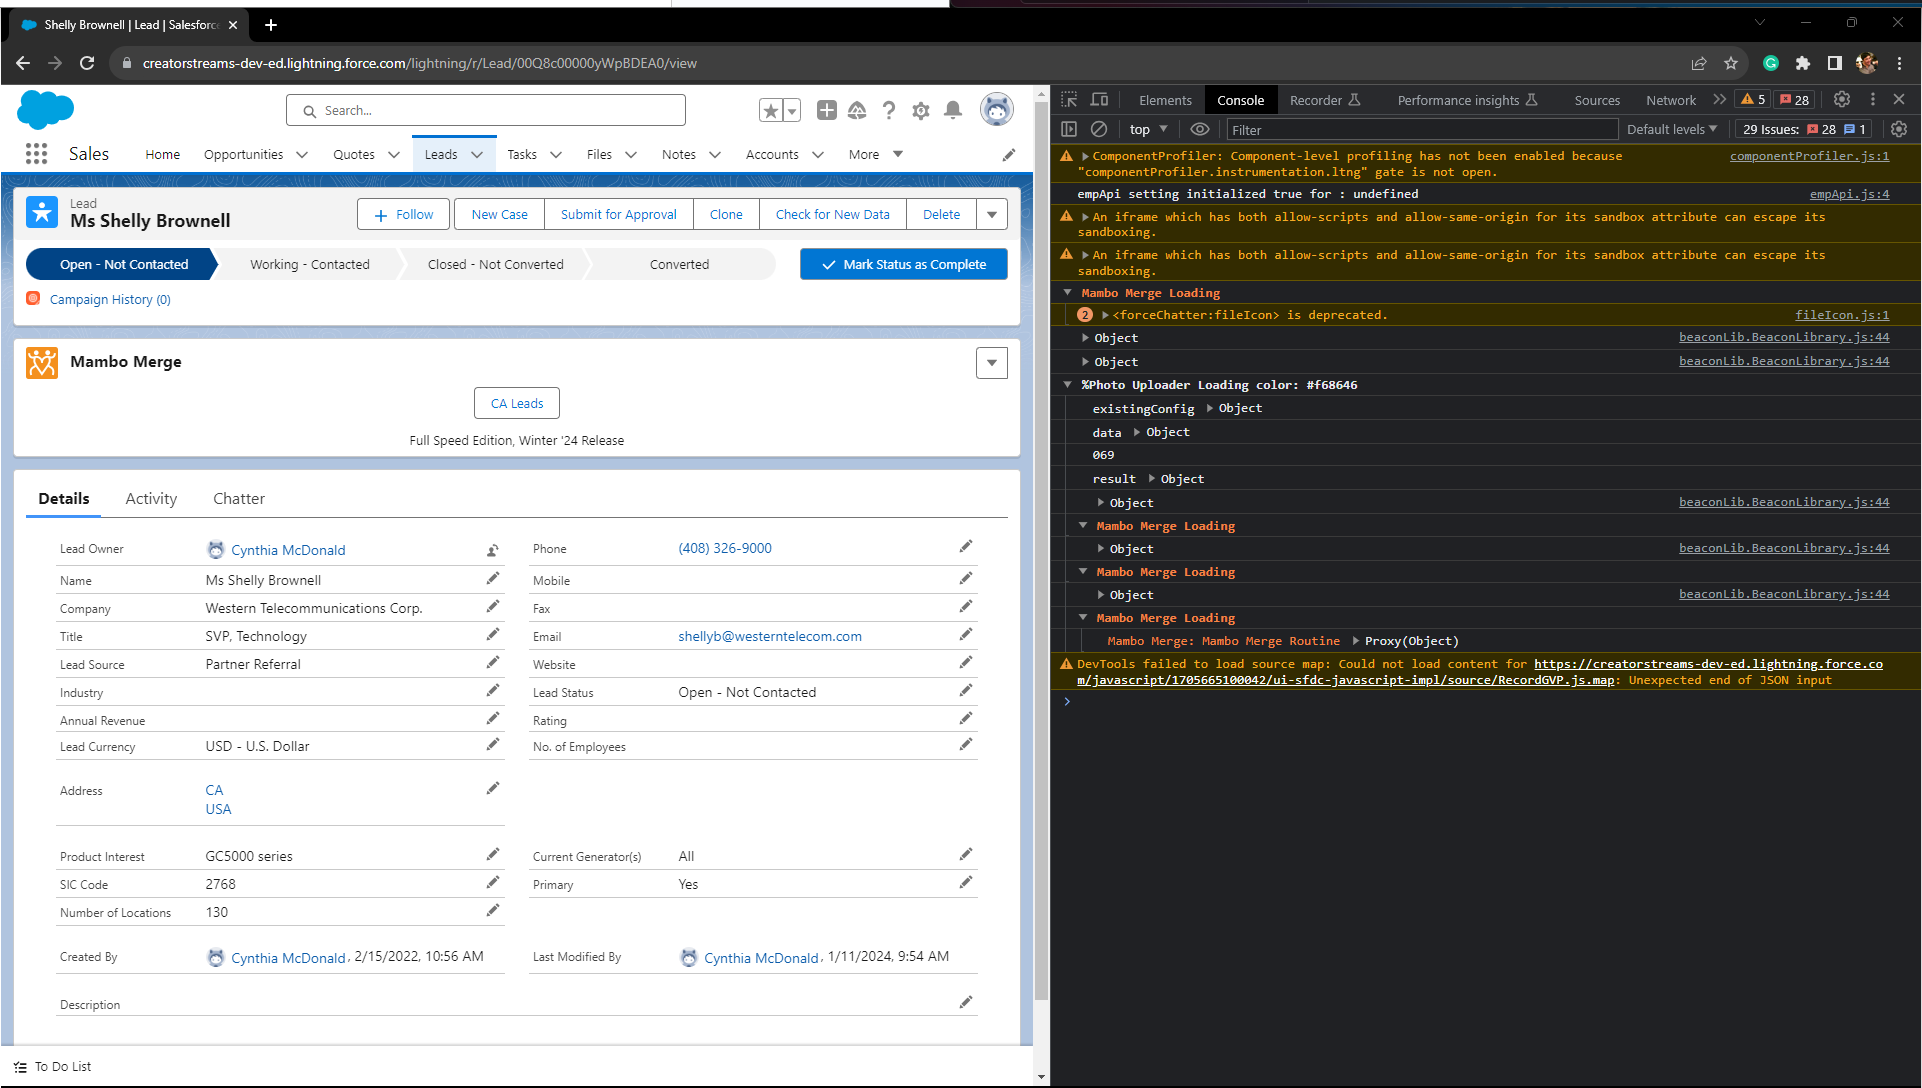
Note: The console provides valuable information aside from only errors, warnings, or messages related to the Mambo Merge component. To Identify Mambo Merge messages look for the orange text.
Step 5 - Open Browser Console Logs Through Keyboard ↵
Using these keyboard shortcuts will swiftly open the browser Developer Console, allowing you to access logs for troubleshooting.
For Chrome browser users, shortcuts are as follows:
Windows, Linux, Chrome OS: Ctrl+Shift+J
Mac: ⌘+Option+J
For Safari users, shortcuts are as follows:
Mac: ⌘+Opt+C
For Microsoft Edge browser users, shortcuts are similar to Chrome:
Windows: Ctrl+Shift+J
Step 6 - Execute Mambo Merge to Generate your Template ↵
Run your Merge in the same Browser page you have the Console Logs open. Any troubleshooting messages will begin to populate, helping you identify the issue.
Activate Debug Mode and Streamline Problem Solving for Your Mambo Merge Component
Now, this component is primed for use in Debug mode, empowering you in troubleshooting any issues you may encounter. By adhering to these steps, you can seamlessly activate Debug Mode, fine-tune its modes, and access console logs to pinpoint and resolve any concerns with your Mambo Merge template. Your next step is to execute your Merge and observe for the troubleshooting messages. You’re all set!
Note: If you experience issues not resolved with Debug Mode, or need more assistance, please reach out to us on our Contact Us Page.